
The U.S. economy has experienced a prolonged period of stability as evidenced by the lowest unemployment rates reported by the Labor Department in 50 years. Many building service contractors (BSCs) want to take advantage of these market conditions to grow their businesses but are facing hiring obstacles. How exactly are BSCs planning to grow? Are they experiencing the same historical obstacles to growth, like labor costs and high turnover rates? And what types of services are cleaning contract companies offering to stay competitive in this fast-paced market?
We set out to find the answers to these questions and more in an effort to help BSCs get a better picture of their peers, the industry, and how their business measures up. In September 2019, CMM conducted its annual BSC/Contract Cleaning Benchmarking Survey, sponsored by Sunbelt Rentals, to better understand the common challenges faced by contractors, compare wages and benefits, discover additional services offered, and gain valuable insight into the gross and projected revenue growth of businesses. The report is intended to give all BSCs ideas for improvement and growth in 2020 and beyond.
Respondent profile
Sixty-nine percent of survey respondents work in corporate management, including BSC owners, and 18% work in general management, including supervisors and site managers. Twenty-nine percent of these BSCs are S corporations (S-corp), 28% are privately held corporations, and 24% are limited liability corporations (LLC). A majority of responding BSCs (58%) operate local businesses, meaning they serve clients within 100 miles of their headquarters. Less than 20% run regional companies and less than 15% operate national businesses. Forty-four percent of responding BSCs have been in the business for more than 30 years and 86% have more than a decade of experience in the industry.
Among the respondents, 32% experienced gross revenue of less than US$1 million in 2018.
The remaining respondents reported gross revenue in 2018 as :
- $1,000,000 to $2,499,999—14%
- $2,500,000 to $4,999,999—12%
- $5,000,000 to $9,999,999—14%
- $10,000,000 to $24,999,999—8%
- $25,000,000 and more—13%
The majority of respondents make more than 20% of their total revenue in commercial, office, and property management facilities. The next highest grossing type of facility is health care, followed by industrial facilities and then education (including K-12 and colleges and universities).
Purchasing processes
In 2019, purchasing processes continued to follow traditional patterns, with the majority of respondents purchasing their products and supplies in person, through jansan distributors (64%), followed by big-box retailers (54%). Wholesalers and office supply dealers were the next two purchasing sources reported. However, the majority of items purchased from wholesalers and office supply dealers are ordered online. Still, 54% of respondents who order their products and supplies through distributors do so online.
Most BSCs (63%) report that they retain complete control of the equipment and supplies they purchase. Only a small percentage of respondents (3%) are required to use specific brands, supplies, and equipment by their customers. Twenty-six percent have clients who dictate some specifics, while they still control the majority of the products used.
Shared challenges
Business for BSCs remains strong, with a few common challenges across the board. More than half of respondents report recruiting, hiring, and retention as the biggest challenges in the field. More than one-third report challenges in maintaining profitable margins to a “large extent”, along with challenges of winning new bids to a “moderate extent.” About one-third of respondents report customer retention and validating cleaning results as challenges to a “small extent.”
Customer complaint type varied among survey respondents. Most customer complaints center on restrooms (39%). Carpeting (16%) and hard floor surfaces (13%) were the next most commonly cited complaints, followed by shared spaces (10%), high-touch surfaces (6%), and trash (4%).
Offering value-added services
When asked what sets them apart, the majority of BSCs surveyed (89%) cited experience and reputation. More than half of respondents (53%) believe that value-added services provide a competitive advantage. Price, industry-recognized certifications, and integrated services rounded out the factors that set businesses apart.
An increased number of BSCs provide specialty cleaning services themselves. Some use subcontractors for specific cleaning services—most often for window cleaning (33%). However, 56% of respondents provide their own window cleaning service. In addition, while 24% subcontract their care of stone and marble surfaces and 23% subcontract entry mat service, still more respondents report providing these services themselves (46% and 30%, respectively). Respondents also report providing their own services for cleanroom and sensitive environments (58%), restroom supplies management (70%) and stripping and recoating hard floors (84%).
Most BSCs offer at least one additional facility maintenance service, but 33% of respondents provide only cleaning services. Additional facility maintenance services offered by BSCs, include:
- Light bulb replacement/relamping (35%)
- Exterior maintenance (32%)
- Painting (25%)
- Landscaping/lawn care (24%)
- Snow removal (22%)
- Waste management/recycling (21%)
- Disaster restoration services/remediation (20%)
- Preventive maintenance/building systems (19%)
- Laundry operations (14%)
- Pest control (12%)
- Building security (8%)
- Other (3%).
Opportunities for growth
As survey respondents look to the future and prepare for growth, they will likely gain new accounts by replacing another BSC or janitorial firm. This replacement represents the majority of new business (89%). Replacing an in-house staff is a much smaller percentage (11%) of new accounts. Only 8% of new accounts come from subcontractors replacing a portion of in-house staff.
Most respondents (38%) have targeted commercial facility types for revenue growth in the next 12 months. Fifteen percent of respondents have focused on health care—including long-term care facilities and medical offices—for growth, followed closely by industrial facilities such as manufacturing plants and warehouses (13%).
The biggest factor affecting growth rates in 2018 compared to 2017 is fairly split among the following:
- Change in marketing strategy (17%)
- Positive acquisition (17%)
- Positive economic factors (16%)
- More competition (12%)
- Negative economic factors (12%)
- Diversified services (11%)
- Loss of a large customer (11%)
- Negative acquisition (4%).
Staffing concerns
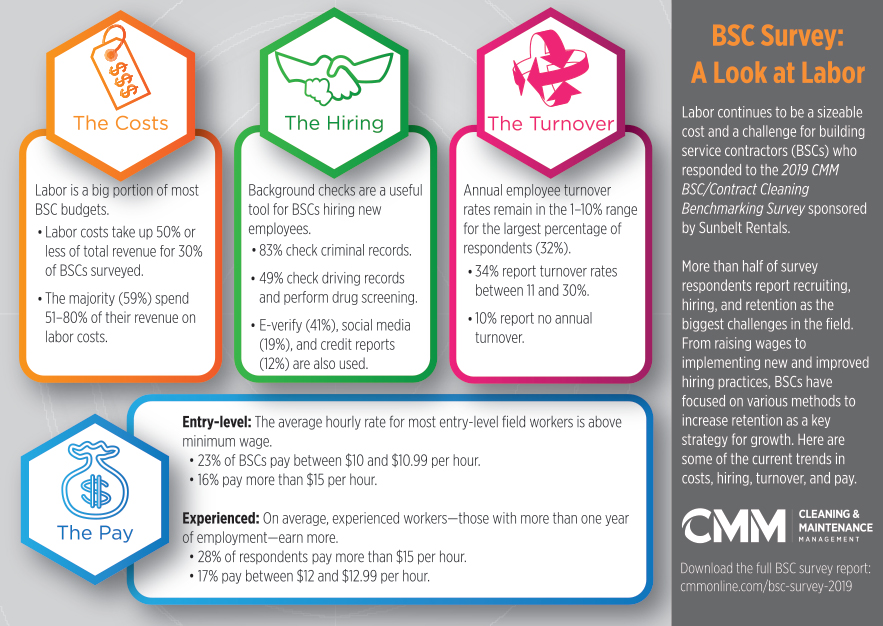
Labor continues to be a sizeable cost and a challenge for BSCs. From raising wages to new and improved hiring practices, BSCs have been focused on various methods to increase retention as a key strategy for growth. Labor is a big portion of most BSC budgets. In fact, labor costs take up 50% or less of total revenue for 30% of respondents, and the majority of respondents (59%) spend between 51% and 80% of their revenue on labor costs.
The average hourly rate for most entry-level field workers is above minimum wage. Twenty-three percent of respondents pay entry-level workers between $10 and $10.99 per hour, and 16% pay more than $15 per hour. Only 3% of respondents pay entry-level workers minimum wage. On average, workers with more than one year of employment earn more. Most respondents report they pay experienced workers more than $15 per hour (28%), while 17% pay experienced workers between $12 and $12.99.
Background checks are a useful tool for BSCs hiring new employees. Most check criminal records (83%), while 49% check driving records and 49% also perform drug screening. Other popular background checks include reference checks (41%) and E-verify (40%). Some BSCs also check social media (19%) and credit reports (12%) during the hiring process.
Annual employee turnover rates remain in the 1 to 10% range for the largest percentage of respondents (32%), while 34% report annual employee turnover rates between 11 and 30%. Ten percent of respondents report no annual turnover.
Summary
CMM’s survey results indicate an optimistic future for BSCs. More than half of respondents expect to grow in the next year (55%) and margins were up for 48% of respondents, with only 15% reporting decreased revenue. BSCs are looking to grow through acquisitions, targeted growth in commercial and health care facilities, by offering specialized cleaning services, and through more rigorous hiring practices and higher wages to minimize turnover.